Copy trading risks are the hidden ways losses propagate from a leader’s strategy into a follower’s account — via platform outages, execution latency and slippage, fee drag, correlation spikes, counterparty weaknesses, legal or prop-firm rule breaches, and tax/reporting pitfalls. This page catalogs those risks and the red flags to watch.
Table of Contents
Intro
Copy trading is not just “copying trades”; it is transmitting a leader’s risk into your own account. Along with entries and exits, you inherit that trader’s drawdown profile, liquidity footprint, and execution frictions. When the market regime shifts, when a platform stutters, or when a strategy grows crowded, small frictions can compound into large deviations from the leader’s results.
This guide documents the major risk categories and the diagnostic signals that often appear before losses escalate. It intentionally does not prescribe settings or allocation rules; those belong in a risk management playbook. Read on to understand what can go wrong and why it happens — then decide whether the strategy, platform, and rule set deserve your capital.
Quick Summary: Top 10 Copy Trading Risks
- Platform outages & execution failures: Downtime or degraded APIs delay signals and orders, causing missed or partial fills.
- Latency, slippage & price gaps: Relay delays widen slippage; news spikes and weekend gaps jump over intended prices.
- Strategy decay across regimes: Edges fade when volatility/liquidity regimes change, stretching drawdowns.
- Hidden costs & fee drag: Spread, commissions, performance shares, and conversions compound to cut net returns.
- Over-correlation across leaders/assets: Different leaders still ride the same macro theme, synchronizing losses.
- Leverage stress & liquidation cascades: High leverage shrinks buffers; adverse moves trigger forced liquidations.
- Custody & counterparty risk: Broker/exchange failures or withdrawal holds can trap funds during volatility.
- Data opacity & stat manipulation: Resets, biased windows, and missing risk stats distort true performance.
- Legal, compliance & prop-firm rules: Jurisdiction limits and firm policies can flag or close copying accounts.
- Tax misclassification & reporting mistakes: Income vs capital treatment and multi-currency basis tracking create audit risk.
Understanding How Risk Propagates in Copy Trading
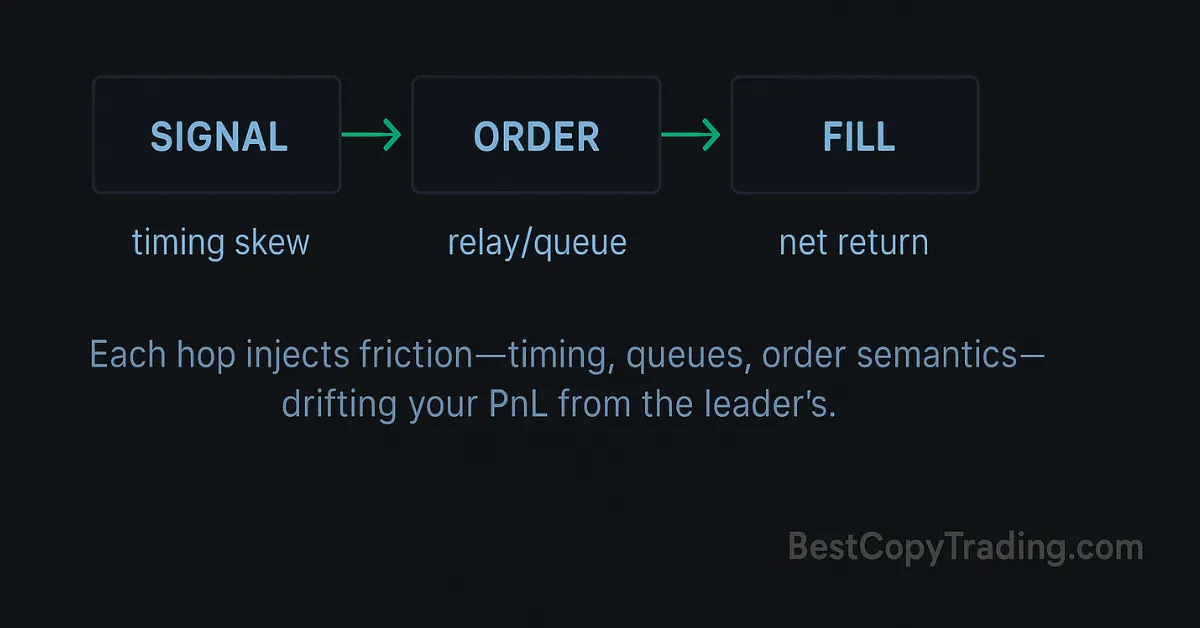
Copy trading transmits more than entries and exits. Risk travels along a pipeline—signal → order → fill → PnL—and each hop can inject delay, distortion, or cost. The sections below explain where the drift comes from and which diagnostics hint that it is getting worse.
Signal → Order → Fill → PnL: where risk sneaks in
A leader’s decision must traverse queues and microstructure before it hits your account. Timestamp skew, relay backlog, and order-type semantics (market, limit, post-only, reduce-only, time-in-force) all impact whether you get the same prices—or miss the move entirely.
- Timing mismatches: Clock drift, batching, and rate limits add tens–hundreds of ms; during news, that’s enough to move the bid/ask.
- Relay queues: Platform throttles and regional outages delay order creation; partial close messages may trail entries by seconds.
- Order-type behavior: Post-only orders skip fills on touch; reduce-only may cancel rather than flip; mismatched TIF expires unfilled.
- Microstructure: Queue position and spread width determine whether your marketable order crosses more ticks than the leader’s.
Scenario: Leader exits on a thin book; your market order crosses multiple levels, turning a small leader loss into a larger follower loss.
Diagnostic signals (no fixes): Median fill delay rising; larger tail slippage on high-volatility bars; more expired/Rejected TIF events.
Capacity & crowding
Strategies degrade when attention scales faster than liquidity. As follower size grows, average order size meets limited depth, spreads widen, and impact pushes fills away from the leader’s prints. Edges that depended on fast entry/exit erode first.
- Footprint inflation: The same setup now moves the book; leader gets near-touch fills, followers chase into thinner levels.
- Depth mismatch: Book cannot absorb synchronized orders across many copiers; partials and remainders slip more.
- Latency amplification: Even small delays matter more when the first wave already consumed best quotes.
Scenario: After a leaderboard surge, the strategy’s average slippage doubles on NFP and CPI prints; month-end PnL variance spikes.
Diagnostic signals (no fixes): Slippage vs. volume correlation up; adverse selection increases; average spread at entry widens post-popularity.
Copy drift
Copy drift is the structural divergence between the leader’s book and yours. It emerges from contract/symbol mapping, lot steps, tick sizes, netting rules, and periodic costs (funding, rollover). Drift compounds subtly until it shows up as persistent PnL gaps.
- Partial fills: Followers get fractional execution; remainders filled at worse levels inflate average entry price.
- Symbol & contract mismatches: XAUUSD vs XAUUSD.m; PERP vs dated futures; different lot step/min tick create rounding error.
- Netting vs hedging: Platforms that net positions collapse opposing trades; followers lose intended leg structure.
- Funding/roll: Overnight swaps, futures funding, and cash-and-carry mechanics shift realized PnL relative to the leader.
Scenario: Leader scales out in three clips; your account nets the position once, then pays funding into the close—PnL trails despite similar direction.
Diagnostic signals (no fixes): Growing gap between leader vs follower average price; higher funding/roll share of PnL; more netting events in logs.
For a step-by-step tour of the plumbing behind signals, routing, and fills, see our plain-English mechanics explainer.
Platform & Infrastructure Risks (You Don’t Control These)
Even if the leader’s strategy is sound, platform and infrastructure conditions can inject loss and variance you cannot directly control. Below are the main ways outages, routing rules, and leaderboard mechanics distort results for followers.
Downtime and degraded service
Service health fluctuates. Planned maintenance, unexpected DDoS, regional CDN failures, or API rate limits can delay or block the relay from leader to follower. During stress, control planes may work while execution planes stall, creating a misleading sense that “the platform is up” while orders silently queue or drop.
- Maintenance windows: Order creation and modification may be restricted or deferred; queued messages execute late at worse prices.
- DDoS/regional failures: Partial connectivity causes followers in certain regions to miss entries or exits the leader received.
- API throttles: Rate limits on bursty news events lead to dropped or retried requests, increasing fill delay and slippage.
- Stale state: Dashboards update slower than matching engines; users see “positions flat” while risk is actually live.
Scenario: A macro release hits during a maintenance window overlap. Leader exits on time; followers receive exit messages minutes later after the gap.
Diagnostic signals (no fixes): Elevated HTTP 429/5xx rates, delayed order acknowledgments, spikes in median/95p relay time, inconsistent position state across UI/API.
Order routing quirks
Order semantics differ by venue and configuration. Flags like reduce-only or post-only, time-in-force (GTC/IOC/FOK), and margin modes (cross vs. isolated) change how exit and partial-close logic behaves when translated from the leader’s account to yours.
- Reduce-only side effects: Exits that would flip direction on the leader may be rejected on the follower, leaving risk on.
- Partial-close propagation: Multi-leg scale-outs can collapse into a single netting event; remainder fills at worse levels.
- Time-in-force nuances: IOC/FOK behavior during wide spreads results in frequent expiries; orders appear “sent” but never fill.
- Cross vs. isolated impacts: Margin mode mismatches alter liquidation distance and trigger prices for the same notional.
Scenario: Leader uses IOC limit exits into a widening spread; follower accounts with stricter TIF reject fills, holding the position into the next volatility burst.
Diagnostic signals (no fixes): Rising reject/expire counts by TIF, higher mismatch rate between intended vs. executed side/quantity, increased forced netting events after partial-close attempts.
Leaderboard Metrics & Data Integrity
Summary statistics can be engineered to look better than the underlying risk reality. Window dressing, survivorship bias, frequent account resets, and unverified track records inflate perceived skill and compress perceived drawdown, drawing followers into capacity they cannot exit cleanly.
- Window dressing: Metrics shown for short “hot” periods omit prior drawdowns, overstating edge persistence.
- Survivorship bias: Underperforming profiles quietly disappear; visible leaders represent only the lucky or recent winners.
- Resets & reboots: Account resets erase loss history; new curves look smooth without legacy context.
- Unverified tracks: Self-reported or lightly audited PnL lacks order-level evidence, masking slippage and fee drag.
Scenario: A newly “top” leader shows 90 days of perfect grind-up. The same handle has two prior resets; combined history reveals large tail losses hidden by the current window.
Diagnostic signals (no fixes): Inconsistent lookback periods across metrics, missing max drawdown disclosure, sudden metric resets, and lack of order-level export.
If you prefer environments that publish deeper order-level evidence and clearer risk stats, compare platforms with transparent stats.
Execution Frictions: Latency, Slippage, Fees & Price Gaps
Execution is where most followers’ results diverge from a leader’s headline curve. Even when the trade idea is identical, timing, book depth, and per-trade costs compound into a persistent net-return wedge.
Latency ladders
The path from leader execution to follower fill passes through multiple hops—leader venue → platform relay → follower venue. On fast pairs and during news, a 200–500 ms delay can shift the best bid/ask by several ticks.
- Clock & queue delay: Timestamp skew and batching increase median and tail latency; queued messages arrive after the price has moved.
- Venue mismatch: Leader fills at Venue A’s microstructure; follower hits Venue B with different spread/queue position.
- Burst events: On NFP/CPI or crypto liquidation waves, message traffic spikes and relay time stretches precisely when price is most sensitive.
Scenario: Leader exits a scalping long on EURUSD; 320 ms later your order hits a widened spread and crosses two extra ticks, turning a small win into flat or red.
Diagnostic signals (no fixes): Rising median/95p fill delay; larger absolute difference between leader vs follower execution timestamps on high-vol bars.
Slippage scenarios
Slippage is the price distance between intended and executed levels. It expands non-linearly when liquidity thins or volatility spikes, and it accumulates across entries, scale-ins, and exits.
- News spikes: Order books gap; marketables sweep levels; limit orders expire unfilled as spreads balloon.
- Thin books: Off-hours FX sessions, weekend crypto opens, or minor pairs push small orders through multiple levels.
- Price gaps: Weekend/elective session gaps jump stop/target prices; fills occur at next available prints, not at the intended level.
- Rollover & funding turns: Liquidity dries near FX rollover; crypto funding windows reprice books as positions rebalance.
Scenario: Weekend gap on XAUUSD opens below the leader’s stop; follower’s exit executes several dollars worse due to the next available quote.
Diagnostic signals (no fixes): Slippage distribution with fat right tail on exits; widening average spread at entry during specific sessions; higher limit-order expiry rate.
Fee drag compounds
Gross vs. net is where expectations often break. Spreads, commissions, performance shares, conversion costs, and withdrawal fees erode returns each hop, turning small statistical edges into flat PnL when compounded over time.
- Spread + commission: Two-sided costs on every round trip; scalps suffer most because edge per trade is small.
- Performance share: Leader/platform take reduces upside asymmetry; the follower’s equity curve lags even with identical fills.
- FX and conversions: Base-currency conversions, stablecoin ramps, and cross-venue transfers add hidden bps.
- Withdrawals & rails: Payout and network fees lower effective ROI, especially for frequent withdrawals.
Scenario: A high-frequency strategy with 0.05% expected edge per trade turns negative after spread+commission of 0.04% and average slippage of 0.03% per execution.
Diagnostic signals (no fixes): Rising “cost-to-gross” ratio; monthly PnL where fees+slippage explain most variance between leader and follower returns.
For a deeper look at how execution frictions shape real-world returns, see our analysis of profitability vs. costs.
Strategy & Market-Regime Risks
Performance is path-dependent. A strategy’s edge is never static; it interacts with volatility, liquidity, and policy backdrops. When regimes rotate or liquidity conditions shift, the same ruleset can morph from smooth compounding to prolonged stagnation or abrupt loss.
Strategy decay
Edges erode as market structure and participation change. Volatility compression after a trending phase, liquidity migration across venues, and policy or microstructure shifts can flatten once-impressive equity curves. Backtests and recent samples often fail to survive these transitions.
- Regime drift: Trend-friendly periods give way to mean-reverting chop; breakout logic bleeds via whipsaws.
- Participation change: New liquidity providers tighten spreads where edge lived; rebates/fees restructure incentives.
- Lookback fragility: Parameter choices overfit to the last cycle; signal quality falls when variance structure shifts.
Diagnostic signals (no fixes): Rising trade frequency with lower expectancy; more false breaks; drawdowns extending beyond prior percentile bands.
Tail risk patterns
Some strategies bank many small wins while hiding exposure to rare but severe losses. Grid/martingale pyramids, short-vol carry, and overfit high-frequency scalps can look stable—until a single regime shock or liquidity vacuum realizes their embedded tail.
- Convexity inversion: Frequent micro-gains mask negative skew; a single outsized move wipes months of PnL.
- Path dependency: Scaling against trend accumulates inventory; a gap or stop-out event realizes the tail.
- Hidden leverage: Net exposure appears small until hedges correlate; liquidation thresholds cluster in stress.
Diagnostic signals (no fixes): High win rate with poor payoff ratio; long calm periods punctuated by abrupt equity drops; growing correlation to “short vol” episodes.
Liquidity & instrument specifics
Instruments embed unique cost and flow mechanics. Crypto perpetuals carry funding cycles; FX liquidity follows session rhythms and roll; metals/indices reprice around macro releases. The same signal can fill, slip, or fail depending on where and when it trades.
- Perps funding swings: Funding flips alter carry and prompt hedging flows; books thin near settlement windows.
- FX session microstructure: Asia/EU/US sessions show distinct depth and spread regimes; rollover compresses liquidity.
- Macro release repricing: CPI/NFP/FOMC compress order books; limit orders expire; marketables cross multiple levels.
Diagnostic signals (no fixes): Session-clustered slippage spikes; higher reject/expiry during known funding/roll windows; event-time drawdowns exceeding typical variance.
Scenario: A leader with a stellar trending record enters a multi-week mean-reverting chop. Breakout attempts whipsaw; equity variance rises; the live drawdown exceeds the strategy’s historical percentile band—without any single “blow-up” trade.
Portfolio Construction Risks (Correlation Is the Silent Killer)
Copy-trader portfolios often look diversified by headcount—yet behave like a single position when regimes flip. Hidden macro overlap, asset-class clustering, and synchronized timeframes can turn many small bets into one big drawdown.
Hidden overlap across leaders
Leaders with different styles can still express the same macro theme (e.g., broad USD weakness, gold momentum, or “long risk” beta). When that driver reverses, losses arrive at the same time across accounts, compressing diversification exactly when it’s needed most.
- Same macro, different wrappers: One trades EURUSD, another XAUUSD, a third NAS100—but all lean on dollar softness.
- Signal co-movement: Entries trigger off correlated indicators (trend + carry + risk-on), aligning exposure windows.
- Event coupling: CPI/FOMC/NFP shocks hit all expressions simultaneously, synchronizing exits and slippage.
Scenario: Three “diverse” leaders draw down together on a sudden USD rally; portfolio PnL drops as if it were a single oversized bet.
Diagnostic signals (no fixes): Rising rolling correlation among leaders; concurrent max adverse excursion; clustered stop-outs around macro timestamps.
Asset-class clustering
FX majors, metals, and crypto trade on different books but can still key off the same driver (rates, dollar liquidity, global risk appetite). Clustering into one regime-sensitive block amplifies drawdowns and reduces the benefit of cross-asset exposure.
- Rates & dollar channel: Metals and FX trend together on real-rate moves; correlation spikes during policy shifts.
- Risk-on coupling: Crypto and indices align under liquidity waves; de-risking unwinds both simultaneously.
- Carry & funding linkages: Funding changes propagate across perps and FX carry, tightening co-movement.
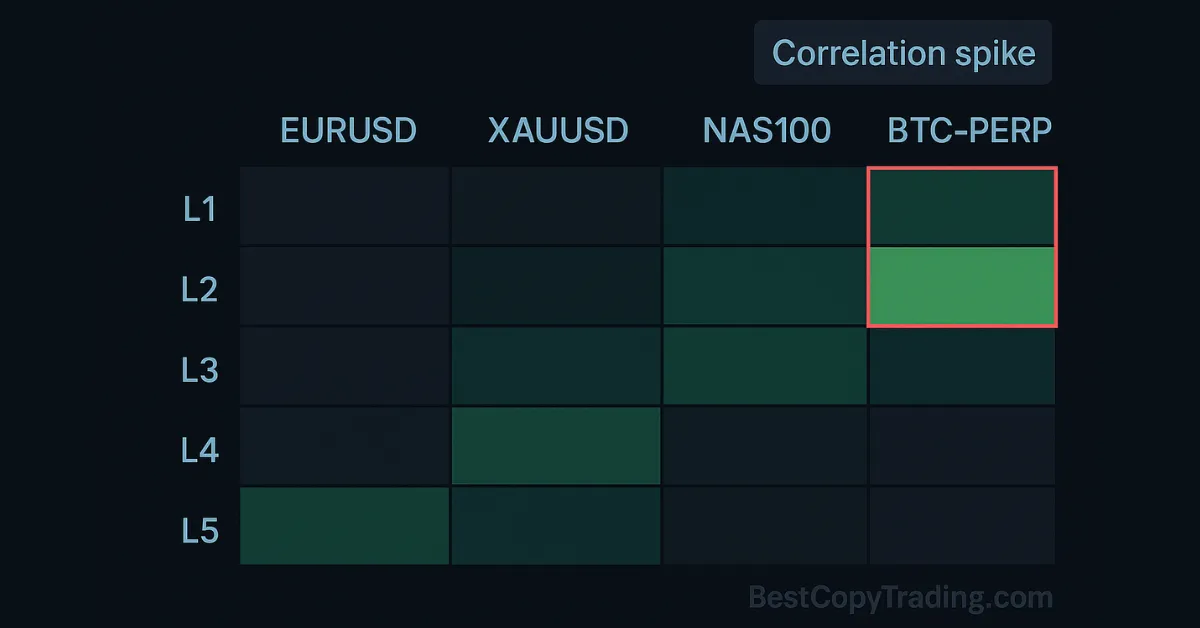
Scenario: A rates surprise lifts the dollar and real yields: XAUUSD sells off, EURUSD slips, BTC underperforms—portfolio bleeds across “different” assets.
Diagnostic signals (no fixes): Heat map shows cross-asset correlation jump; tail co-movement rises on event days; dispersion collapses during stress.
Timeframe alignment
Leaders operating on the same intraday horizon respond to identical microstructure and news cadence. Stacking multiple short-term momentum profiles concentrates variance, deepening peak-to-trough swings when volatility compresses or gaps wider.
- Session sync: EU/US session traders enter within minutes of each other; exits also cluster.
- Volatility channeling: Shared bar lengths and ATR filters trigger trades simultaneously on the same spikes.
- Drawdown stacking: A whipsaw hour hits all intraday leaders at once, magnifying realized variance.
Scenario: Four intraday trend leaders flip long on the same breakout; reversal within the hour stops all four—portfolio DD mirrors a single 4× position.
Diagnostic signals (no fixes): Elevated intra-hour overlap of entries/exits; rising same-bar MAE across leaders; higher correlation at short lags (1–15 minutes).
For context on execution style trade-offs that can amplify or dampen these effects, see our note on human vs automated approaches to execution risk.
Counterparty, Custody & Operational Risks
Beyond market moves, your outcomes depend on who holds your funds, how positions are custodied, and which tools sit between you and the exchange. Failures here can impair access, delay exits, or distort PnL even when the trade idea is right.
Broker/exchange solvency and rehypothecation
Financial soundness and custody practices vary widely. Claims of client-fund segregation, proof-of-reserves snapshots, or insurance schemes may not cover timing or liquidity gaps during stress. Off-exchange settlement and omnibus accounts add layers you cannot see.
- Segregation vs. reality: “Segregated” funds can still face operational freezes if internal ledgers or banking partners fail.
- Proof-of-reserves limits: Snapshots omit liabilities and off-balance obligations; coverage can be partial or time-lagged.
- Omnibus exposure: Pooled accounts obscure your specific claim; unwind priority is uncertain during insolvency events.
- Off-exchange settlement gaps: Delays between matching engines and custodial movements leave windows of unsecured exposure.
Scenario: A venue faces a liquidity shortfall; withdrawals pause. Your profitable copy positions cannot be realized or moved, and funding/fees continue to accrue while risk remains open.
Diagnostic signals (no fixes): Withdrawal queues lengthen; new KYC/KYB asks mid-incident; status pages show “degraded” custody/matching while dashboards appear normal.
Stablecoin & conversion dependencies
Copy flows often ride fiat ramps, stablecoins, and cross-chain bridges. Each layer adds a failure mode: depegs, bank rail outages, or chain congestion that slows rebalancing and exits when volatility is highest.
- Depeg risk: Stablecoins can trade off par during stress, altering effective PnL when converting in/out.
- Rail friction: Bank cutoffs and compliance holds delay fiat legs, stranding collateral on-platform.
- Chain congestion: Gas spikes and mempool backlog slow transfers; margin top-ups and exits miss intended windows.
- FX basis: Cross-currency conversions introduce hidden bps and timing basis that compound fee drag.
Scenario: A stablecoin wobbles below par during a market break. You transfer to hedge, but chain congestion and wider off-ramp spreads convert a small drawdown into a material loss.
Diagnostic signals (no fixes): Stablecoin price dislocations on major venues; rising on-chain gas; settlement ETAs slipping from minutes to hours; widening fiat on/off-ramp spreads.
Tooling risk
Third-party copiers, bridges, and automation layers expand the attack surface and operational complexity. API scopes, token storage, and version drift can lead to unauthorized actions, silent failures, or behavior that no longer matches the leader’s intent.
- API scope/keys: Overbroad permissions or poorly rotated keys invite misuse; IP allowlists and sub-accounts are not universal.
- Version drift: Copier and venue updates desynchronize message formats; partial-close or reduce-only flags behave unexpectedly.
- Silent retries: Error handling masks failures; orders appear “sent” but never reach the book under throttle.
- Permission creep: Added features request wider access over time; audit trails remain shallow or fragmented.
Scenario: An update changes how partial closes are encoded. Leader scales out in three clips; your bridge nets the position once, leaving residual risk through a news spike.
Diagnostic signals (no fixes): Rising reject/expire counts; mismatches between intended vs. executed side/qty; unexplained permissions requested after updates; gaps in order/exec logs.
If you rely on third-party infrastructure, review vetted copier options that publish clearer permissions, change logs, and order-level evidence.
Legal, Compliance & Rule-Set Risks (Prop Firms Included)
Copy trading operates under country-specific laws, platform terms, and prop-firm rules. Breaches can result in forced position closures, frozen balances, or account termination even when trades are profitable.
Jurisdictional constraints
What is permitted in one country may be restricted or licensed in another. Retail marketing rules, derivative classifications, and cross-border solicitation policies vary—affecting whether a given copy mechanism is allowed for your residency or instrument set.
- Instrument scope: Spot vs. CFDs/futures treated differently; leverage caps and suitability checks impact availability.
- Cross-border frictions: Residents blocked from certain venues or features due to licensing or sanctions screening.
- Marketing rules: “Social/copy” features may be classed as portfolio management or signal provision in some regimes.
Scenario: A follower relocates; local rules reclassify the copied instrument as restricted, auto-disabling the copier during live exposure.
Diagnostic signals (no fixes): Regional feature gating; KYC prompts tied to residency updates; instrument warnings or leverage changes after policy updates.
Prop-firm specific rules
Proprietary trading firms commonly restrict third-party copiers, mirrored latency patterns, and certain automation modes. “Risk-manager” EAs may be permitted only within narrow boundaries. Violations can void evaluations or funded status without recourse.
- Third-party copier bans: External mirroring tools flagged by network or execution signatures.
- Latency-arb detection: Synchronized entries within milliseconds across accounts raise enforcement reviews.
- EA boundaries: Trade managers allowed for risk control, but auto-execution or signal replication may be disallowed.
- Termination clauses: Breach → instant account closure; profits under review or forfeited per terms.
Scenario: Multiple accounts show near-identical timestamps and sizing; compliance classifies activity as prohibited copying and closes the accounts mid-cycle.
Diagnostic signals (no fixes): Audit requests for logs/screens; warnings referencing “mirroring” or “signal replication”; sudden rule updates during evaluation phases.
Disclosure & client-agreement pitfalls
Many platforms require acceptance of product disclosures and fee schedules during onboarding. Few readers internalize how performance fees, conflict disclosures, or auto-liquidation rules apply to copied positions under stress.
- PDS & risk statements: Define liquidation triggers, slippage tolerance, and right to suspend services during volatility.
- Fee disclosures: Performance shares, conversion costs, and withdrawal fees apply even when copying underperforms.
- Conflict & execution policies: Internalization, routing preferences, or last-look behavior can affect follower fills.
Scenario: A volatile session triggers an execution-suspension clause; copied exits are delayed while fees and funding continue to accrue.
Diagnostic signals (no fixes): New checkbox prompts for updated terms; added “extraordinary market conditions” language; revised execution/fee schedules reflected in help center but not in-app.
For an overview of how legality varies by country and instrument, review our guide on country-level legality. If you operate within firm rule sets, see consolidated prop-firm stances in one place.
Tax & Reporting Risks (When Profits Become Problems)
Copy trading generates cash flows beyond simple trade PnL. How those flows are classified, converted, and recorded can change your liability—and create friction during reviews or audits—even if the strategy is profitable.
Income vs. capital classification
Tax handling is jurisdiction-specific and instrument-dependent. “Performance share” or copy fees can be categorized differently from trading gains, and timing rules (realization vs. accrual) may not align with how platforms report returns.
- Category mismatch: Copy fees and rebates may be treated as ordinary income while trade PnL is capital—two schedules, two rates.
- Timing mismatches: Periodic fees post monthly/weekly; realized PnL posts per trade—recognition windows diverge.
- Instrument nuance: Perps funding, FX roll, and dividends/swaps may each carry distinct treatment from spot gains.
Scenario: A flat trading month still produces taxable income from performance shares and funding credits, creating a tax bill despite near-zero net PnL.
Diagnostic signals (no fixes): Platform statements break out “fees/revenue share” separately; differing line items across annual vs. monthly reports.
FX conversions & basis tracking
Multi-currency accounts and wallets complicate cost basis. Conversions, stablecoin ramps, and cross-venue transfers introduce timing and rate bases that drift from trade-level PnL, especially when base currency changes mid-period.
- Base-currency switches: Changing account base (e.g., USD → USDT → EUR) creates new basis layers and realized FX on transfer.
- FIFO/LIFO divergence: Different venues apply different lot methods; consolidated books show phantom gains/losses.
- Transfer timing: Delays between execution and conversion rates generate basis deltas not visible in trade PnL.
Scenario: Profitable USD trades are converted into a weakening stablecoin before off-ramp; effective return shrinks once FX basis is applied.
Diagnostic signals (no fixes): Growing gap between trade PnL and statement PnL after currency moves; inconsistent lot IDs across exports.
Record-keeping gaps
Copy flows often involve partial closes, adjusted trades, and funding/fee lines that do not appear in simple order histories. Missing or incompatible exports increase reconciliation time and raise audit friction.
- Partial-close opacity: Aggregated netting hides leg-level details; average price reconstruction becomes unreliable.
- Adjusted trades: Post-factum corrections (break trades) alter timestamps/quantities after the fact.
- Fragmented logs: Funding, fees, rebates, and conversions live in separate exports with inconsistent IDs.
Scenario: An audit request seeks order-level evidence for a month with multiple partial closes; the platform export nets positions and omits fee/funding line IDs, stalling reconciliation.
Diagnostic signals (no fixes): No unique execution IDs across reports; missing “events” feed for fees/funding; CSV schemas that change mid-year.
For jurisdiction-aware overviews and typical reporting lines, review our guide on copy-trading tax specifics.
Early-Warning Dashboard: Signals Your Risk Is Rising (Diagnosis Only)
These signals indicate growing fragility in your copy-trading setup. They are diagnostics only—use them to recognize rising risk before losses compound. (No settings or remedies here.)
Execution signals
- Fill delay drift: Median/95p follower fill delay rising vs. last month; spikes during news bars.
- Slippage bands widening: Larger absolute slippage vs. same-time quotes; tail slippage on exits thickening.
- Spread-at-entry up: Average spread on entries increasing around the same sessions/events.
- Reject/expire counts: IOC/FOK expiries and reduce-only rejects trending higher.
Scenario: On CPI/NFP releases, follower exits post 300–600 ms after leader; exit slippage doubles vs. prior months.
Performance signals
- Variance rising: Weekly return variance climbs while expectancy stays flat → noisier equity path.
- Drawdown persistence: Live DD length breaches the strategy’s historical percentile band.
- Payoff ratio compression: Win rate stable but average win/average loss deteriorates.
- Alpha decay markers: More false breaks; lower edge per trade in identical market states.
Scenario: Equity curve remains sideways despite normal trade frequency; payoff ratio slips from 1.6→1.1.
Portfolio signals
- Correlation spikes: Rolling correlation across leaders jumps on event days and stays elevated.
- Concentration creep: Same-symbol exposure inches above internal caps across multiple leaders.
- Timeframe sync: Entry/exit timestamps cluster within narrow windows across the portfolio.
- Dispersion collapse: Winners no longer offset losers; PnL moves as one block.
Scenario: A USD surprise triggers synchronized losses across EURUSD, XAUUSD, and NAS100 leaders within the same hour.
Platform signals
- Partial outages: Status pages show “degraded” API/matching while UI appears normal.
- Stat inconsistencies: Leaderboard metrics reset or change lookback without notice.
- API error rates: 429/5xx spikes; delayed order acknowledgments; desync between UI and export logs.
- Custody friction: Withdrawal queues lengthen; new KYC requests mid-incident.
Scenario: During volatility, orders mark “sent” in the dashboard but never receive execution IDs in the export.
When these diagnostics stack up, move from observation to action with our risk management playbook.
Risk Lexicon (Short, Scannable Definitions)
Brief definitions of common copy-trading risk terms (one–liners, scan-friendly).
- Copy drift Structural PnL divergence between leader and follower due to timing, fills, contract mapping, fees, or netting rules. Capacity The trade size a strategy can absorb before slippage and impact degrade its edge.
- Crowding Too many followers/leaders chasing the same signal, widening spreads and worsening fills at entry/exit.
- Tail risk Low-probability, high-severity losses (e.g., grid/martingale blowups, short-vol snapbacks).
- Fee drag Cumulative reduction from spreads, commissions, performance share, conversions, and withdrawals versus gross returns.
- Fill quality How close executed prices are to intended levels, including slippage, partials, and queue/latency effects.
- Regime shift Change in volatility/liquidity/policy backdrop that breaks a strategy’s assumptions and decays its edge.
- Funding Periodic payments on perpetual futures that transfer between longs/shorts, altering net PnL vs. spot.
- Netting vs. hedging Netting collapses opposing positions into one net exposure; hedging keeps offsetting legs separate.
- Correlation spike Sudden jump in co-movement across leaders/symbols, causing synchronized drawdowns.
- Liquidation buffer Distance (price or margin) between current exposure and forced liquidation level.
- Slippage bands Expected ranges of adverse/positive slippage; widening bands indicate deteriorating execution conditions.
Real-World Risk Scenarios (Brief Vignettes)
Concise vignettes that show how copy-trading risk materializes in practice. (No fixes—examples only.)
News-driven spike
A high-impact release widens spreads and thins depth. The follower’s exit posts 40–120 ms after the leader and crosses extra levels; slippage erases the trade’s edge despite a timely leader exit.
Crowded alpha
Leaderboard popularity doubles average follower size. On event bars, quoted depth is consumed earlier; the leader still shows tight prints but the follower pays a spread cost that has doubled, compressing monthly expectancy.
Regime flip
A trend strategy faces multi-week mean-reverting chop. Breakouts whipsaw; the live drawdown exceeds the historic percentile band even though per-trade logic hasn’t changed.
Rule breach
Prop-firm surveillance flags copier-like latency patterns across accounts. Despite profitable trades, compliance enforces a mid-cycle account closure per terms.
New to these concepts? New to copy trading? Start with the basics.
Setting Expectations (No Promises, Just Reality)
Copy trading is not a paycheck. Results arrive in streaks because markets are volatile and capacity changes over time. A “hands-free” process still inherits the leader’s drawdowns, execution frictions, and regime shifts—so hands-free ≠ risk-free.
- Variance is normal: Monthly returns will swing. Green months can be followed by flat or red months without anything “breaking.”
- Losing months happen: Even robust strategies cluster losses when volatility or liquidity regimes rotate.
- Risk of ruin vs. volatility: Volatility is the up-and-down of returns; risk of ruin is the chance of capital falling to an unrecoverable level. They are not the same.
- Expectation vs. experience: A positive long-run edge can still feel uncomfortable over realistic holding periods.
- Before allocating: Understand how execution costs, correlation, and leader behavior translate into your account’s path—not just headline ROI.
For context on real-world return ranges, fee drag, and variance you should anticipate, see our deep dive on returns and what’s realistic.
FAQs – Copy Trading Risks
Key risks include platform outages and degraded APIs, execution latency and slippage, strategy decay across regimes, hidden fee drag, correlation spikes across leaders, leverage-driven liquidations, counterparty/custody issues, opaque stats, prop-firm rule violations, and legal/tax pitfalls.
Because of copy drift: timing mismatches, partial fills, symbol/contract differences, netting vs hedging rules, funding/roll costs, and venue microstructure. These frictions compound into persistent PnL divergence even when trade direction is the same.
Spread, commissions, performance shares, currency conversions, and withdrawals create fee drag, while slippage widens during news and thin liquidity. Together, they push your net return below the leader’s headline figures over time.
Yes. Outages, throttles, or regional failures can delay or block order relay, causing missed entries/exits or poor fills. A leader’s winning trade can translate into a follower’s loss if execution paths break.
Policies vary. Many firms restrict third-party copiers and latency-arb patterns, while allowing manual replication or risk-manager EAs within narrow limits. Violations may trigger account closure and forfeiture under terms.
Legality differs by country and instrument; disclosure and client-agreement clauses matter during stress. Tax treatment (income vs capital) and multi-currency basis tracking can diverge from platform statements. For context on effort vs. risk trade-offs, compare copying with self-execution.
Related Reading (One-Click)
- Begin with the mechanics: how copy trading works
- Evaluate if it’s right for you: is copy trading legit?
Stay ahead of risk.
Get event-time alerts, risk checklists, and new red-flag findings from our team. We post concise signals when volatility, slippage, or platform issues start to rise.