Looking to build copy trading passive income without the hype? At BestCopyTrading.com, this guide shows you how to turn inherently volatile returns into a planned cash-flow routine. You’ll learn to design a payout ladder, set withdrawal rules, keep a 2–3-month buffer, cap risk per leader, and diversify for smoother income. No promises, no magic bots—just a practical framework to manage variance, protect capital, and make wiser decisions about when to compound versus when to pay yourself first.

TL;DR (Key Takeaways)
- Passive income from copy trading is possible but variable.
- Treat it like cash-flow management, not a salary.
- Your edge: a withdrawal policy, risk caps, and leader diversification.
- Expect dry months and drawdowns; design buffers.
Table of Contents
What “Passive Income” Really Means in Copy Trading
Passive income in copy trading isn’t a paycheck that arrives on schedule—it’s cash-flow extracted from a volatile equity curve. Your job is to design rules that convert uneven trading results into a planned withdrawal routine without starving future growth.
Income Streams vs Equity Growth
Income = net withdrawals
- Formula: Income (month) = Realized PnL − (fees + costs) − amount you leave in the account.
- Measured in cash you actually move out to a bank/wallet.
- Goal: predictable cash-flow, even if it’s small.
Growth = compounding balance
- Formula: Growth (month) = Change in equity after costs before withdrawals.
- Reinvested gains increase position size and future variance.
- Goal: maximize equity curve over time.
Why mixing them hurts
- In green months you withdraw too much (starving compounding).
- In red months you still withdraw (draining buffer), then panic-cut great leaders.
- Fix: separate policies—a payout rule for income and a compounding rule for growth—applied in that order.
Quick framework
- Decide primary intent first: cash-flow or growth.
- If cash-flow: set a withdrawal % range (e.g., 40–70% of net gains) and a skip rule in loss months.
- If growth: compounding is default; withdrawals are event-based (quarterly, or only above a high-water mark).
The Three Levers of Cash-Flow
- Payout frequency
- Weekly = smoother income but higher fee/operational drag.
- Monthly = common middle ground.
- Quarterly = lowest friction, best for mixed income + growth.
- Variance tolerance
- Define your acceptable month-to-month swing in payouts (e.g., ±30%).
- Use it to throttle withdrawals: if variance > target, reduce payout % or skip this cycle.
- Capital buffer ratio
- Keep 2–3 months of target payouts as idle buffer (cash or low-risk allocation).
- Purpose: survive losing streaks without forced withdrawals that lock in drawdowns.
Putting levers together (example)
- Target payout: $500/month → buffer $1,000–$1,500.
- Monthly withdrawals of 50% of net gains, skip on loss months.
- If two loss months in a row: pause payouts, rebuild buffer to target, then resume.
Who Should (and Shouldn’t) Pursue Passive Income Here
A good fit ✅
- Time-poor investors who prefer systems over tinkering.
- Those with realistic horizons (accepting dry months and drawdowns).
- Users willing to document rules and stick to them (payout %, skip rule, rebalance cadence).
Probably not a fit ❌
- Anyone who needs fixed monthly income for bills—copy trading cash-flow is variable.
- Investors with zero drawdown tolerance or who react emotionally to dips.
- Users who won’t maintain a buffer or who chase last month’s top performer.
For a returns-first perspective, see our profitability guide.
Income Architecture: From Deposit to Monthly Payouts
Design this like a cash-flow system, not a “get started” checklist. The objective is predictable withdrawals from an unpredictable equity curve.
Choose Leaders for Cash-Flow, Not Just High ROI
You’re optimizing payout stability, so weight selection toward leaders with low drawdowns, steady win expectancy, and moderate trade frequency.
Screening rubric (use all three):
- Drawdown discipline: 12-month max DD ideally ≤ 15–20%; average DD on winning months stays contained.
- Win expectancy & cadence: Positive expectancy with consistent cadence (e.g., weekly trade activity), not feast-or-famine bursts.
- Equity curve quality: Fewer V-shaped recoveries; look for slope + smoothness over headline ROI.
- Holding period & swap impact: Prefer leaders whose average holding times don’t rack up funding costs that eat income.
- Fee compatibility: After copy/performance fees, PnL still supports your target withdrawal %.
Copy settings (income-friendly defaults):
- Use equity-% copy ratio (keeps sizing adaptive).
- Cap per-leader allocation at 15–25% of equity.
- Set stop-follow if leader breaches a DD threshold (e.g., 1.2× their 12-month max DD).
- Avoid ultra-high frequency scalpers if your platform/latency causes slippage—slippage reduces net income.
Picking a venue? See our best copy trading platforms once here for feature and fee comparisons.
Staggered Payout Calendar
Smooth cash-flow by laddering withdrawals across the month so one bad week doesn’t wipe out your paycheck feel.
4-week ladder example:
- Week 1: Leaders A1, A2
- Week 2: Leader B1
- Week 3: Leader A3
- Week 4: Leaders B2, C1 (C1 pays only if green this month)
Rules that make it work:
- Green-only payouts: Withdraw from a leader’s rung only if its PnL ≥ 0 for the period.
- Skip, don’t double: If a rung is red, skip; do not double next week to “catch up.”
- Payout % band: Withdraw 40–70% of net gains per rung; keep the rest to sustain compounding/buffer.
- Monthly cap: Optional ceiling on total withdrawals (e.g., ≤ 3% of equity) to prevent over-extraction after lucky streaks.
- Quarterly sync: Once per quarter, reassign rungs based on leader cadence so each week carries similar expected variance.
Operational tip: Batch withdrawals once per week to limit fees and admin friction; log each rung’s result (green/red, amount).
The Capital Buffer
Your buffer is the shock absorber that lets you pause payouts during losing streaks without panic or forced redemptions.
How much buffer?
- Rule of thumb:2–3× your target monthly payout.
- Target payout = $600/mo → Buffer = $1,200–$1,800.
- Higher-variance leader sets or tighter living needs → lean to 3×.
Buffer policy:
- Loss month = no withdrawals. Use green months to refill buffer back to target before resuming normal payouts.
- Refill priority: Gains first top up the buffer → only the excess follows your payout % band.
- Emergency brake: If equity drawdown exceeds X% (e.g., 10–12%), suspend all payouts and rebuild buffer to full before any discretionary withdrawals.
Quick math you can paste into your planner:
- Required Buffer = Months of cover × Target Monthly Payout
- Net Payout (month) = Gross PnL − (fees + costs) − Compounded Portion (respect “skip on red”)
- Pre-select leaders with low DD and steady cadence.
- Set equity-% copy; per-leader cap ≤ 25%; DD-based stop-follow.
- Build a Week-1 → Week-4 payout ladder; green-only; skip-don’t-double.
- Fund a 2–3× buffer; refill before paying yourself after drawdowns.
- Review ladder & leaders monthly; full rebalance quarterly.
Payout Mechanics & Policies (Make Them Before You Start)
Design rules now so you’re not negotiating with emotions later. Use these as copy-paste policies in your doc.
“Pay-Yourself-First” Withdrawal Rule
Policy: At month end, withdraw a fixed percentage of net gains to your external wallet; the remainder tops up buffer and growth.
- Baseline band:40–70% of net monthly gains
- Net monthly gains = Realized PnL − (copy/performance fees + trading costs + FX/withdrawal fees)
- Ordering:
- Top up buffer to target (2–3× monthly payout)
- Apply withdrawal % to any excess
- Residual stays for compounding
- Example: Net gains = $1,000; buffer shortfall = $300; withdrawal % = 60%
- Refill buffer: $300 → buffer
- Remaining: $700 → withdraw $420 (60%); $280 left to compound
Do/Don’t:
- ✅ Lock the % band for 90 days; revise quarterly
- ✅ Automate a calendar reminder to execute on the same day each month
- ❌ Don’t “catch up” missed withdrawals after a red month
Compounding Modes
Pick one mode and stick to it for a full quarter.
| Mode | What You Do | When to Use | Trade-offs |
|---|---|---|---|
| Off | Withdraw most gains (e.g., 70%) | You prioritize cash-flow over equity growth | Slower growth, steadier payouts |
| Partial | Split gains (e.g., 50% withdraw) | Balance income + future growth | Middle road; needs discipline |
| On | Withdraw minimal (e.g., 0–20%) | Building account size; early stage; high buffer | Higher variance; delayed cash-flow |
Switch rules (quarterly only):
- Move Off → Partial if buffer ≥ 3× and payouts feel too small
- Move Partial → On if your goal changes to growth OR leader set turns unusually stable
- Move On → Partial/Off if variance rises or you’re missing income targets
Income Volatility Guardrails
Hard stops that protect the plan.
- Skip on red: If net monthly PnL ≤ 0, no withdrawals that month
- Two-strike review: If 2+ consecutive loss months, suspend payouts next month, audit leaders & risk (exposure caps, DD), and rebuild buffer to target before resuming
- DD brake: If equity drawdown > X% (e.g., 10–12%), suspend payouts until equity recovers above high-water mark − (X/2)
- Max extraction cap: Optional ceiling ≤ 3% of equity/month to avoid over-withdrawing after lucky streaks
- Fee check: If (fees / gross gains) > 25% in any month, cut withdrawal % by 10 pts next month and review slippage/latency
One-pager you can paste into your policy:
- Buffer first, then apply withdrawal % to the excess
- Mode: Off / Partial / On (locked for 90 days)
- Red month = skip; 2 red = review & rebuild
- DD brake at X% → suspend payouts
- Monthly cap and quarterly rebalance enforced
Risk Tiers Built for Income Stability (Not Max ROI)
Design your portfolio for cash-flow reliability, then let growth happen within guardrails. This model keeps withdrawals smoother and protects you from single-leader shocks.
3-Tier Allocation
Tier A — Stability (50–70%)
- Profile: Low drawdown, steady trade cadence, transparent stats.
- Role: Cash-flow backbone (most rungs on your payout ladder come from here).
- Selection hints: 12-month max DD ≤ 15–20%, consistent weekly activity, minimal fee drag.
Tier B — Growth (20–40%)
- Profile: Controlled DD with higher upside, moderate variance.
- Role: Boosts equity so Tier A isn’t your only engine; feeds future payout size.
- Selection hints: Clear risk controls, recoveries without deep V-shapes, acceptable latency/slippage impact.
Tier C — Experimental (0–10%)
- Profile: New/uncertain strategies with strict rules.
- Role: Optional “R&D” sleeve; never relied on for payouts.
- Rules: Hard cap exposure, strict stop-follow, green-months-only for any discretionary withdrawal.
Rebalancing cadence: Light monthly check; full rebalance quarterly to bring tiers back to target weights.
Position Sizing for Followers
- Use equity-% copy ratio so sizes auto-scale with account equity.
- Per-leader cap: ≤ 15–25% of equity (lower end for Tier B/C).
- Stop-follow triggers: Breach of leader DD limit (e.g., 1.2× their 12-month max DD), rule violations, or prolonged cadence drought.
- Correlation check: Avoid overloading highly correlated leaders (same instrument/timeframe) within a single tier.
Example (quick math):
- Equity $10,000 → Per-leader cap 20% = $2,000 notional max via equity-% copy.
- Tier A at 60% = $6,000 distributed across 3 leaders → ~$2,000 cap each.
Income Health Metrics
Track these three to keep the plan honest:
- Monthly Net Payout / Peak Equity
- Measures cash-flow efficiency relative to your best capital base.
- Target is personal; consistency matters more than level.
- Payout Consistency (σ)
- Standard deviation of monthly net payouts.
- Lower σ = smoother income. If σ rises, tighten withdrawal band or add Tier A weight.
- Drawdown-to-Payout Ratio
- DD / Avg Monthly Net Payout over the last 6–12 months.
- If this ratio creeps up, your income is getting “expensive” in risk terms → shift weight toward Tier A, review leader caps.
Want the control knobs that keep these metrics in line? See our copy trading risk management guide.
Fees, Lags, and Hidden Frictions That Eat Income
Income planning must be done on net results. The items below are the usual cash-flow killers—and how to contain them.
Performance & Copy Fees (and the order they’re taken)
- Order matters: Platforms typically deduct trading costs first, then apply performance/copy fees on remaining gains.
- High-water mark: Prefer fee models that use a high-water mark so you don’t pay fees on “recovered” profit.
- Fee cliffs: Some leaders charge tiers (e.g., 10% up to X, 20% above X). Know the bracket you’re likely to sit in.
- Containment tips:
- Compare net ROI after fees (leader page often shows gross—adjust manually).
- Favor leaders with moderate turnover if copy fees are %-based per ticket.
- Audit monthly: fees / gross gains and keep it ≤ 25%; above that, review leader/venue.
Slippage/Latency & Partial Fills
- Root causes: Leader’s fills vs your follower fills can differ due to latency, route differences, and partial fills in fast markets.
- Symptoms: Entry worse by a few ticks/pips; TP missed; SL hit earlier; fragmented fills.
- Containment tips:
- Avoid ultra-HFT/scalpers if your platform isn’t low-latency.
- Prefer leaders with moderate holding times (minutes → hours) where copy latency is less punitive.
- Test on small size; measure average slippage per trade (in $ or pips) and include it in your fee ledger.
- Consider VPS/local routing if supported.
Funding, Spreads, Conversion & Withdrawal Fees
- Trading frictions:
- Spreads/commissions: wider at off-hours; avoid paying for noise.
- Funding/overnight: long holds can leak income; know instrument schedules.
- Money movement:
- FX conversion (USD↔local) and network/withdrawal fees add up fast with weekly micro-payouts.
- Batch payouts monthly to reduce fixed fees.
- Containment tips:
- Align leaders’ session/holding style with tight-spread windows.
- Keep a settlement wallet in payout currency to reduce FX churn.
- Track each fee line item—don’t let “misc” hide trend growth.
The “Income Net” Formula
Use this every month to calculate what you can actually pay yourself.
- Gross PnL = realized profit/loss before all account & transfer fees.
- Trading Costs = spreads, commissions, funding/overnight, slippage.
- Compute monthly, then apply your withdrawal policy.
Building a “Payout Ladder” (Templates)
Think of the ladder as a cash-flow calendar that spreads withdrawals across weeks so one bad streak doesn’t sink your whole month. You’re converting a bumpy equity curve into staggered, rule-driven payouts.
4-Rung Ladder
Goal: Distribute leaders by cadence and stability so each week has a similar expected variance.
- Rung 1 (Week 1): Leaders A1, A2
Backbone rung. High-stability (Tier A). Expect most “green” weeks here. - Rung 2 (Week 2): Leader B1
Mid-variance (Tier B). Adds some upside without overloading a single week. - Rung 3 (Week 3): Leader A3
Stability refresher—keeps the month from becoming front-loaded. - Rung 4 (Week 4): Leaders B2, C1 (if green)
Growth + optional experimental. C1 is never a source of required income.
How to assign leaders to rungs (quick rubric):
- Sort leaders by weekly trade cadence and 12-mo max DD.
- Place Tier A names on Rungs 1 & 3; Tier B on 2 & 4; Tier C only on 4.
- Check that each rung’s expected variance feels comparable; if not, swap a leader to balance.
Simple pacing math:
- If your target monthly payout is $800 and you run 4 rungs, your theoretical weekly target ≈ $200—but you never force the amount; you withdraw % of net gains from the rung only when green.
Skipping Rules
Use green-only logic and never “catch up” the next week. This is how you keep variance from snowballing.
- Green-only: Withdraw from a rung only if its period PnL ≥ 0.
- Skip, don’t double: If a rung is red, skip entirely. Do not double the following week to compensate.
- Payout band: When green, withdraw 40–70% of net gains from that rung; remainder feeds buffer/compounding.
- Weekly cap (optional): To avoid over-extraction after lucky runs, cap weekly withdrawals at ≤ 1% of equity (tunable).
- Quarterly shuffle: If a rung is red too often, swap one leader with a steadier name to smooth the schedule.
Pseudocode you can paste into your policy:
For each Week in {1..4}:
If RungPNL(Week) > 0:
Withdraw = RungPNL * PayoutPct // 0.40–0.70
If WeeklyCapEnabled: Withdraw = min(Withdraw, 0.01 * Equity)
Move remaining gains to Buffer/Equity per compounding mode
Else:
Withdraw = 0 // skip, don’t double next week
Log(Week, RungPNL, Withdraw)
Refill Logic
Your ladder works only if buffer first remains sacred—especially after drawdowns.
- Drawdown trigger: If account DD > X% (e.g., 10–12%), pause all payouts across rungs.
- Refill priority: In the next green periods, direct 100% of net gains to the buffer until it reaches 2–3× monthly target.
- Resume criteria: When buffer is back to target and equity has recovered above your resume threshold (e.g., high-water mark − X/2), return to normal payout band.
- Two-red rule (monthly): If 2+ weeks in a month are red, reduce payout % by 10 points next month and review leader mix and rung assignments.
Order of operations (month-end):
- Top up buffer to target (2–3× monthly payout).
- Apply payout band to any excess profits (respect weekly rung logic).
- Log & audit fees, slippage, and the DD-to-Payout ratio; adjust tier weights quarterly.
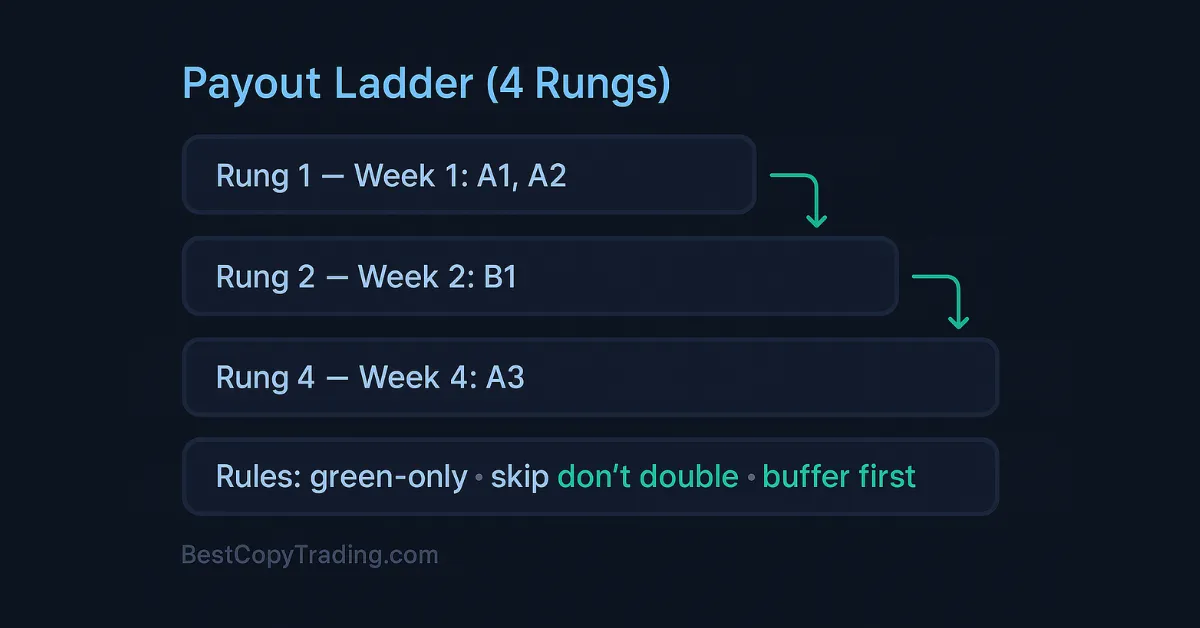
Payout Ladder (4 Rungs)
- Rung 1 — Week 1: A1, A2 (green-only, 40–70% payout)
- Rung 2 — Week 2: B1 (mid-variance)
- Rung 3 — Week 3: A3 (stability refresher)
- Rung 4 — Week 4: B2, C1 (C1 pays only if green)
- Green-only withdrawals; if red → skip (no doubling next week).
- Payout band per rung: 40–70% of net gains.
- After big DD: pause, refill buffer to 2–3× monthly target, then resume.
Case Studies (Cash-Flow Lenses)
Numbers beat theory. These three scenarios show how payout rules, buffers, and tiers translate into (un)smooth income.
Case 1 – Conservative Income
Profile: Small capital, Tier-A heavy, low variance; aims for 1–2% monthly net payout with a proper buffer.
- Capital: $5,000
- Tier mix: A 70% ($3,500), B 25% ($1,250), C 5% ($250)
- Per-leader cap: 20% of equity ($1,000)
- Ladder: A1/A2 (W1), B1 (W2), A3 (W3), B2 (W4; C1 only if green)
- Withdrawal band: 40–60% of net green by rung
- Buffer target: 2.5× monthly payout goal
- Target payout = 1.5% × $5,000 = $75 → Buffer ≈ $190 (round to $200)
Month example (net after fees):
- W1: +$90 → withdraw 50% = $45
- W2: +$10 → withdraw 40% = $4
- W3: −$20 → skip
- W4: +$40 → withdraw 40% = $16
- Total payout: $65 (~1.3% of equity)
- Notes: Skipping W3 prevents “catch-up” risk; buffer remains ~$200+
Why this works
- Tier-A backbone and low band prevent over-extraction.
- Small absolute payouts, but high consistency; σ(payout) stays low.
Policy to copy:
- “Withdraw 40–60% of weekly green; skip red weeks. Keep buffer at $200+; if 2 red weeks in a month, drop band by 10 pts next month.”
Case 2 – Balanced Income + Growth
Profile: Medium account, partial compounding; targets 2–4% average monthly payout, accepts dry spells.
- Capital: $20,000
- Tier mix: A 55% ($11,000), B 35% ($7,000), C 10% ($2,000)
- Per-leader cap: 18% of equity ($3,600) with stricter 12% for Tier C
- Compounding mode: Partial (50% withdraw, 50% compound on green)
- Buffer target: 3× monthly payout goal
- Target payout (midpoint 3%) = $600 → Buffer = $1,800
Month example (net after fees):
- W1: +$500 → 50% = $250
- W2: +$150 → 50% = $75
- W3: −$300 → skip
- W4: +$400 → 50% = $200
- Total payout: $525 (2.6% of equity)
- Compounded back: $525 (supports future size)
Trade-offs
- Payouts fluctuate more than Case 1, but equity grows during greens.
- Dry months occur; buffer absorbs the shock and prevents forced exits.
Policy to copy:
- “Partial mode 50/50 for at least 90 days. If 2 red weeks occur, reduce payout band next month to 40% and review rung assignments.”
Case 3 – Aggressive (Why It Often Fails for Income)
Profile: High fees, slippage, deeper DD; missed payouts break the income plan.
- Capital: $10,000
- Tier mix: A 30% ($3,000), B 50% ($5,000), C 20% ($2,000)
- Per-leader cap: 25% ($2,500) — too high for B/C correlation
- Leaders: Faster cadence (scalpy), more sensitive to latency
- Withdrawal band: 60–70% (over-extraction in greens)
- Buffer target: Only 1× monthly goal (insufficient)
- Target payout (aimed unrealistically at 4%) = $400 → Buffer kept ≈ $400
Month example (gross vs net pain):
- Fees/slippage inflate to 28% of gross gains on greens.
- W1: +$350 gross → +$250 net → withdraw 70% = $175
- W2: −$600 → skip (buffer now used for living costs)
- W3: +$150 net → withdraw 70% = $105
- W4: −$500 → skip
- Total payout: $280 (below target), buffer depleted; equity down on month.
What went wrong
- Under-buffered (1× vs needed 2–3×) → forced withdrawals after red weeks.
- High extraction starved recovery capital.
- Latency-sensitive leaders magnified slippage → lower net.
- Over-cap per leader increased DD-to-Payout ratio.
Fixes
- Raise buffer to $800–$1,200 (2–3×), drop payout band to 40–50%.
- Cut per-leader cap to 15–20%; move weight from C→A.
- Replace scalpers with moderate holding time leaders; measure slippage.
Quick Comparison Table
| Case | Capital | Target Net Payout | Buffer Target | Tier Mix (A/B/C) | Mode | Result Pattern |
|---|---|---|---|---|---|---|
| 1 | $5k | 1–2% ($50–$100) | $200–$250 | 70/25/5 | Off/Low % | Small but steady |
| 2 | $20k | 2–4% ($400–$800) | $1.8k | 55/35/10 | Partial | Variable, equity grows |
| 3 | $10k | 3–4% aimed | $800–$1.2k* | 30/50/20 | High % | Misses targets; equity stress |
*Needed (fix), not what they had.
Taxes & Compliance for Passive Income
Cash-flow is great—until tax time. Keep this section focused on what hits your wallet (withdrawals) vs what’s reportable (often realized gains) and build habits that make filing painless.
Trackable, Audit-Ready Records (withdrawals vs deposits)
- Single source of truth: Maintain a master ledger with columns: Date, Platform, Leader(s), Realized PnL, Fees (copy/perf, trading, FX, withdrawal), Withdrawal, Deposit, Net Transfer, Tx Hash/Ref, Notes.
- Reconcile monthly: Match platform reports to bank/crypto wallet statements; flag any timing differences (e.g., end-month trades settled next month).
- Separate buckets:
- Operational PnL (realized trading result)
- Movement (deposits/withdrawals, transfers)
- Costs (fees, spreads, funding, FX)
- Evidence pack: Keep PDF/CSV exports, screenshots of high-water mark/fee calculations, and a copy of your payout policy (shows intent and consistency).
- Retention: Store encrypted backups (cloud + local). Many regulators advise 5–7 years of records—follow your local rule.
Classifying Income vs Gains (varies by jurisdiction)
- Not all withdrawals are “income”: A withdrawal is just a transfer unless it reflects realized profit. Track the taxable event (often realized trades) separately from cash movements.
- Capital vs ordinary: Depending on country and account type, results may be taxed as capital gains, foreign-source income, or business income. Your activity level (frequency, intent, structure) can influence classification.
- Fees & offsets: Some jurisdictions allow deducting trading/copy/performance fees and FX/transfer costs against gains. Keep itemized proof.
- Cross-border platforms: If the venue is offshore, you may need foreign asset disclosures, FATCA/CRS reporting, or FEMA-style forms (country-specific).
- Entity choice: If payouts become meaningful, ask a professional about using an LLC/Ltd/sole-prop wrapper for cleaner accounting, limited liability, and expense tracking.
For deeper country-by-country nuances and examples, see our copy trading taxes guide.
Year-End Hygiene (close the books cleanly)
- Export everything: Full-year trade history, fee breakdowns, copy/performance fee logs, and wallet/bank statements (CSV + PDF).
- Reconcile fees: Sum by category: trading commissions, spreads (if reported), funding/overnight, copy/performance, slippage estimates, FX/withdrawal fees.
- Compute tax basis:
- Realized PnL per instrument/currency (convert to home currency at compliant rates).
- Distinguish unrealized from realized—only the latter is typically taxable.
- High-water mark check: If your platform uses HWM for fees, store a year-end screenshot; it supports why certain months had zero performance fee.
- Statements & notes: Draft a short year summary (one page): starting equity, deposits, withdrawals, realized PnL, total fees by bucket, closing equity, notable events (strategy change, DD brake triggered).
- Hand-off pack for accountant: Master ledger, exports, FX rate sources, payout policy, entity docs (if any). Saves hours and reduces audit risk.
Bottom line: Treat taxes like part of your income system—log as you go, separate PnL vs cash movement, and keep fee evidence. That’s how you protect your passive income from becoming an administrative headache.
Tools & Automations That Help Income Seekers
Focus on tools that make cash-flow predictable: see your ladder at a glance, act fast on risk breaches, and keep tiers in shape without guesswork.
Income Dashboard
What to see in one screen (minimum viable):
- Ladder rungs: Week 1–4 with each leader assigned, status (green/red), rung PnL, payout taken (% and $).
- Net payout tracker: Month-to-date Net Payout, vs target, and Payout Consistency (σ) over last 6–12 months.
- Buffer months: Current buffer value expressed as × monthly target (e.g., 2.4×); color-code <2× as warning.
- Tier weights: A/B/C current % vs target %, drift %, and a “rebalance due” flag.
- Fee drag widget: Fees / Gross gains % (rolling 30D & 90D); alert if >25%.
- DD & brakes: Current equity DD vs threshold; “payouts paused” banner when the brake is active.
Data you should log to power it: Date, rung, leader, realized PnL, payout %, payout $, fees (by type), buffer $, equity, DD%, tier, notes (latency/slippage).
Alerts & Cut-Switches
Automations that protect income first—they act before emotions do.
- Leader DD breach: If leader DD > 1.2× their 12-month max DD → auto stop-follow and tag for review.
- Portfolio DD brake: If equity DD > X% (e.g., 10–12%) → suspend payouts and switch dashboard state to “Refill Mode.”
- Volatility spike: If ATR/volatility on major instruments jumps above set band → temporarily reduce payout % by 10 pts next green.
- Fee spike: If (fees / gross gains) > 25% this month → alert to review venue/leader/latency; cut next month’s payout % by 10 pts until improved.
- Rung red frequency: If 2+ red weeks in a month → recommend rung reshuffle (swap one B→A) and lower payout band next month.
Simple logic you can encode:
“If Condition → Action → Cool-down window (e.g., 30 days) → Review checklist.”
Rebalancing Cadence
Keep tiers honest so your income engine (Tier A) isn’t diluted over time.
- Monthly (light):
- Bring Tier A/B/C back within ±3–5% of target weights.
- Check correlation clusters (don’t stack similar symbols/timeframes).
- Quarterly (full):
- Replace underperformers, re-assign rungs to balance variance week-to-week.
- Re-decide compounding mode (Off/Partial/On) for next 90 days.
- Refresh risk settings: per-leader caps, DD thresholds, payout band.
Want help choosing between human-led copying and full automation? Read our concise comparison of copy trading vs bot trading to decide which tools fit your workflow.
Bottom line: A good dashboard shows cash-flow reality, alerts enforce risk discipline, and scheduled rebalances keep your tiers aligned—this trio is what turns volatile returns into a repeatable income routine.
Common Passive-Income Pitfalls (and Fixes)
Turn these “gotchas” into rules you can actually follow.
Emotional compounding (up) / panic de-risking (down).
Fix: Use mode locks (Off/Partial/On) for 90 days and rule-based switches: red month = skip; 2 red months = review + rebuild buffer; DD brake = pause payouts.
Chasing last month’s top ROI → Use stability metrics.
Fix: Rank leaders by 12-mo max DD, cadence consistency, and DD-to-Payout ratio before ROI. Require a minimum sample size (e.g., 6–12 months).
Withdrawing 100% of gains → Starves buffer → future droughts.
Fix: Lock a 40–70% payout band and a buffer-first rule (refill to 2–3× monthly target before paying yourself).
One-leader dependency → Fragile income.
Fix: Enforce tiered, multi-leader allocation with per-leader cap ≤ 15–25% and avoid correlation clusters (same symbol/timeframe).
Ignoring fees & latency → Gross looks good, Net is bad.
Fix: Track Fees/Gross % (aim ≤ 25%) and average slippage per trade; prefer leaders with holding times where copy latency matters less.
Common Passive-Income Pitfalls (and Fixes)
-
Pitfall: Chasing last month’s top ROI
Fix: Prioritize stability metrics (12-mo max DD, cadence, DD-to-Payout). -
Pitfall: Withdrawing 100% of gains
Fix: Payout band 40–70% with buffer-first to 2–3× monthly target. -
Pitfall: One-leader dependency
Fix: Tiered, multi-leader mix; per-leader cap ≤ 15–25%; de-cluster correlations. -
Pitfall: Ignoring fees & latency
Fix: Track Fees/Gross ≤ 25%; log slippage; avoid ultra-scalpers on slow routes. -
Pitfall: Emotional compounding / panic de-risking
Fix: Lock compounding mode for 90 days; apply skip/red-month and DD brake rules.
Set Up Your Passive-Income Plan (Mini How-To)
A quick, printable flow you can follow end-to-end—focused on cash-flow, not generic onboarding.
- Define Monthly Target Payout & Buffer Months
- Pick a target payout (e.g., 2–3% of equity) and a buffer of 2–3× that amount.
- Write your skip rule up front: loss month = no withdrawal.
- Map Tier Weights & Leader Count
- Start with Tier A 50–70%, Tier B 20–40%, Tier C 0–10%.
- Set per-leader cap ≤ 15–25% (lower for B/C). Aim for 3–6 leaders total.
- Choose a Payout Ladder (4 weeks)
- Assign leaders to Week 1→4 rungs.
- Enforce green-only withdrawals and no doubling after a skipped week.
- Write Withdrawal & Skip Rules
- Payout band: withdraw 40–70% of net gains when green; refill buffer first.
- Document DD brake (e.g., 10–12% equity DD → pause payouts).
- Implement Alerts & Rebalance Cadence
- Alerts: leader DD breach, portfolio DD, fee ratio >25%, 2+ red weeks.
- Monthly light rebalance; quarterly full review + mode decision (Off/Partial/On).
- Run a 90-Day Pilot (small size)
- Track Net Payout, Payout σ, and DD-to-Payout ratio.
- Scale only if buffer stays ≥ target and variance is acceptable.
Need a first-time setup walkthrough? See our short beginner’s guide to starting copy trading.
Passive-Income Plan — 6-Step Mini How-To
- Target & Buffer: Choose a monthly payout and keep a 2–3× buffer. Loss month = no withdrawal.
- Tiers & Caps: A 50–70%, B 20–40%, C 0–10%; per-leader cap ≤ 15–25%.
- Payout Ladder: Assign Week 1→4 rungs; green-only; never double after skips.
- Rules: Withdraw 40–70% of net gains when green; refill buffer first; set a DD brake.
- Automation: Alerts for DD/fees/red-weeks; monthly light rebalance; quarterly full review.
- 90-Day Pilot: Start small; track Net Payout, payout σ, DD-to-Payout; scale if buffer holds.
First-time setup? Read our beginner’s guide to starting copy trading.
FAQs – Passive Income with Copy Trading
It can produce cash-flow, but it won’t be perfectly regular. Use a payout ladder (weekly rungs), a 2–3× buffer, and “green-only, skip on red” rules to smooth variance. Treat it like cash-flow management, not a salary.
Set your buffer to 2–3× your target monthly payout (e.g., $600 target → $1,200–$1,800 buffer). Use the higher end if leaders are higher variance or if you want steadier withdrawals.
Yes. Pick a mode and lock it for a quarter: Off (maximize cash-flow), Partial (split gains, e.g., 50/50), or On (growth-first with minimal withdrawals). Don’t switch mid-drawdown.
No. Red month = skip withdrawals. Next green periods should refill the buffer back to target before you pay yourself again. If there are 2+ loss months, review leader mix, exposure caps, and payout band.
Start with 3–6 leaders, Tier-A heavy for stability. Cap per-leader exposure at 15–25% and avoid stacking highly correlated strategies (same symbols/timeframes).
Final Thoughts
Passive income here is cash-flow management under uncertainty, not a paycheck.
Your system—tiers, payout ladder, withdrawal/skip rules, and a 2–3× buffer—matters more than any single leader.
Start small, measure net (not gross), and upgrade the system quarterly based on real variance and fee drag.
Join the BestCopyTrading Telegram
Get payout-ladder templates, buffer calculators, and quarterly checklists. Real tips, zero hype — built for passive-income workflows. Join on Telegram